It started as a simple Python script (I affectionately named it infodump), but then I thought, “What if this were actually enjoyable to look at?” So, I sprinkled in some AI magic and a few clever libraries, and suddenly, the tool was smarter, prettier, and a whole lot more useful.
From a Gist to Github Repo. Here is a link to the updated Github repo.
So, What’s Shiny and New?
-
Rich, Colorful Outputs: Thanks to the
richlibrary, data now comes wrapped in stylish panels, bold headers, and vibrant colors—think disco party, but for your system diagnostics. -
Improved Temperature Monitoring with lm-sensors: Since we’re playing exclusively in Linux territory, I ditched the generic methods for good old
lm-sensors. Now temperature readings aren’t just more accurate—they’re genuinely insightful about what’s sizzling under the hood. -
Nvidia GPU Temperature Checks: Got an Nvidia GPU? Good news—I added dedicated monitoring using
nvidia-smi. This means your GPU no longer keeps secrets about its temperature. -
Cleaner, Modular Code: The code went through some serious spring cleaning. Now each function has its own neat little job, making it way easier to maintain and expand in the future.
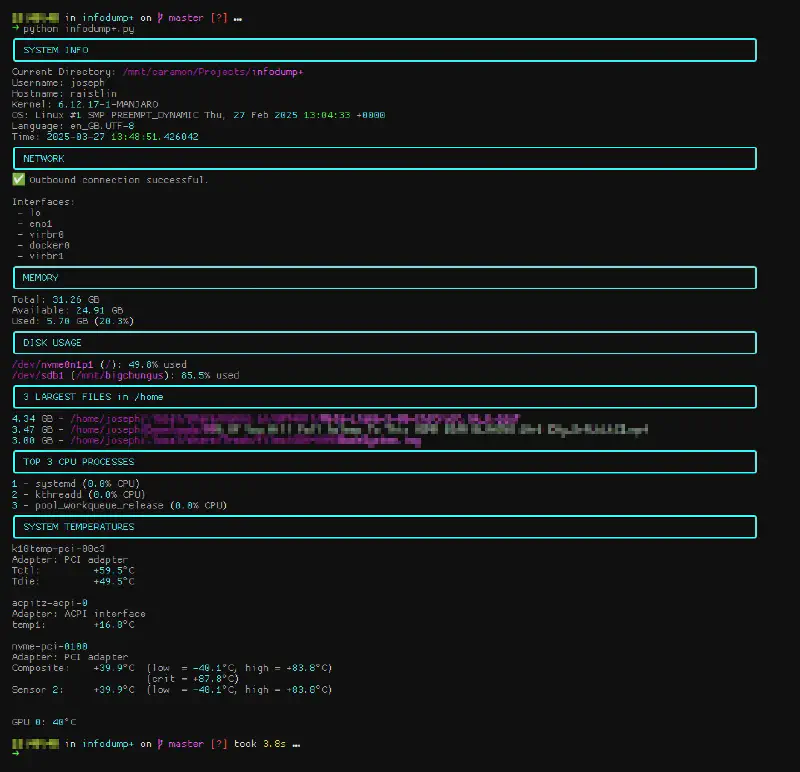
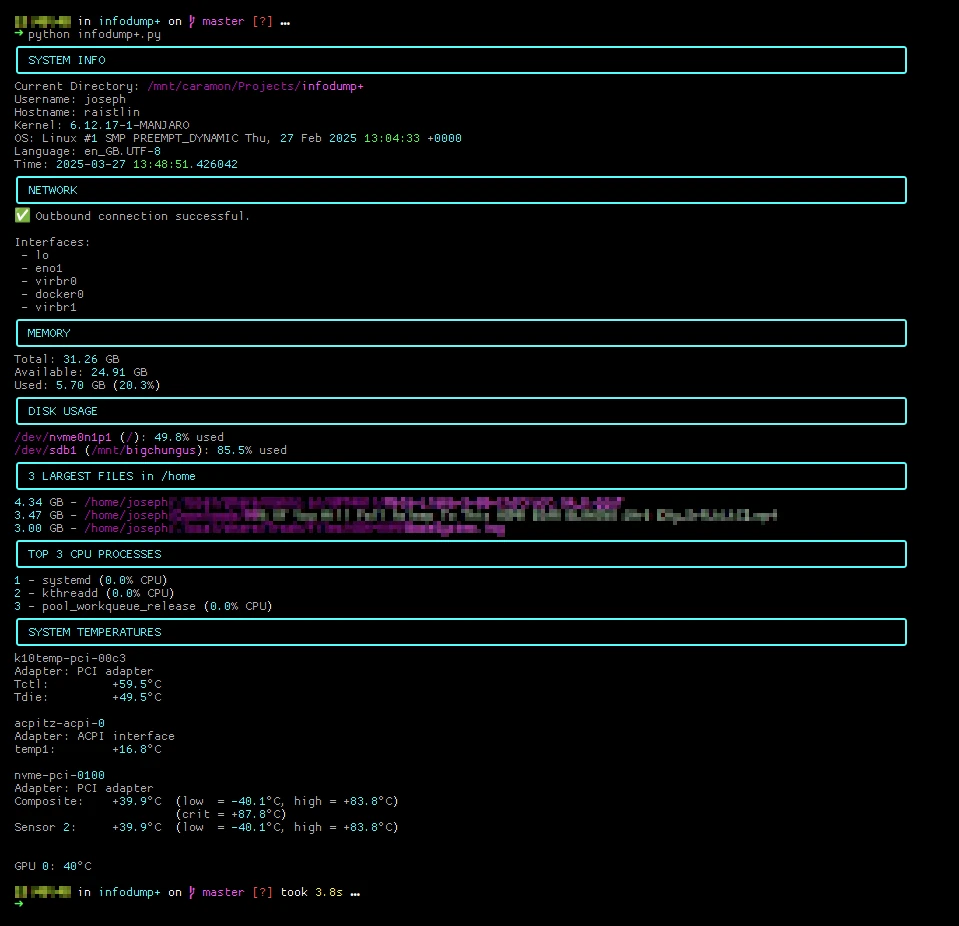
Sample Output
What I Learned Along the Way
This project was a gentle reminder that small upgrades often deliver big results. Here’s the takeaways:
-
Iterate, Iterate, Iterate: Incremental improvements often beat sweeping changes—baby steps lead to big leaps.
-
Lean into AI: Bringing AI onboard sparked ideas and improvements I hadn’t anticipated. Let tech inspire you!
-
Keep It Fun: Even system diagnostics benefit from a bit of playfulness. If you’re enjoying it, chances are, so will others.
So, that’s how my modest little script turned into something unexpectedly delightful. Now, running diagnostics is less chore and more cheer. Cheers to that!